An Easy In-Office Test to Evaluate Foot Function
By Thomas Michaud, DC
For almost a century, researchers have been attempting to identify specific dynamic and static anatomical measurements that predict three-dimensional motion during the gait cycle.
In 1949, Hiss3 published Functional Foot Disorders, in which he suggested hypermobility of the first metatarsal was a major factor in the development of forefoot pathology. Despite significant problems with reproducibility, many foot specialists continue to use this biomechanical approach today.4
In 1971, Root, et al.,5 published what is without doubt the most widely referenced source on biomechanical measurements. In their text, Biomechanical Examination of the Foot, they describe a range of specific goniometric biomechanical measurements that were theorized to predict three-dimensional motion patterns present during the gait cycle.
Most notably, these authors suggest frontal-plane alignment of the rearfoot and forefoot is strongly predictive of motion during the gait cycle, and that frontal-plane alignment of the rearfoot is a predictor of pronation. For decades, these measurements have been used to justify orthotic intervention.
Although Root, et al., were pioneers in the field of biomechanics, their described measurements were difficult to reproduce6 and it was later proven that their off-weight-bearing measurements did not reflect the true ranges available during weight-bearing.7 More importantly, the various goniometric measurements suggested by the authors did not predict three-dimensional lower extremity motions present during the gait cycle.8-10
This was first noted in 1989 by Hamill, et al.9 Using a hand-held goniometer, these researchers measured the 16 static and dynamic variables described by Root, et al., and then evaluated three-dimensional motion as 24 subjects walked over a force platform. Unfortunately, not one of the static measurements predicted dynamic motion.
In a similar study, McPoil and Cornwall8 took 17 static and dynamic measurements on 27 young adults and performed two-dimensional analysis of rearfoot motion during walking. Again, none of the static measurements predicted dynamic motion.
In both of these studies, the presence of forefoot varus and valgus had no correlation with the degree of pronation present during the gait cycle. Frontal-plane alignment of the rearfoot and lower leg was also proven to poorly correlate with three-dimensional motion during the gait cycle.
More recently, researchers from Australia suggest that measuring frontal plane motion of the calcaneus during the gait cycle is of limited clinical value because rearfoot eversion does not correlate with three-dimensional movement patterns present during the gait cycle.10 In fact, these researchers state that because calcaneal eversion correlates so poorly with three-dimensional motion during the gait cycle, measurements of calcaneal alignment should not be used when prescribing orthotics.
The Arch Height Ratio for Predicting Motion During Gait
Because static calcaneal eversion correlates poorly with triplanar motion, and since frontal-plane measurements possess poor interrater reliability, several researchers have attempted to determine in-office measurements that actually predict motion during gait. To date, the most extensively studied measurement is the arch height ratio. (Fig. 1) Developed by Williams and McClay,11 this measurement is performed by noting the length of the foot at the distal aspect of the hallux (A). This number is divided by two and the height of the dorsal foot is measured at this point (B).
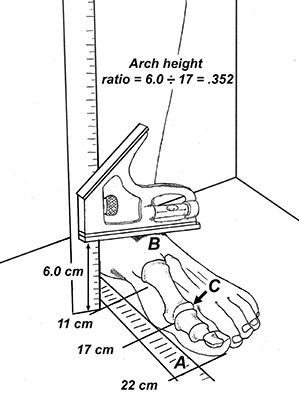 Fig. 1. The arch height ratio measurement. To see a video of this test, read this article on the DC app.The arch height ratio is determined by dividing the height of the dorsal foot by the length of the foot, measured at the center of the first metatarsophalangeal joint (C). If the resultant number is less than .275, the arch is characterized as low, while people with high arches present with an arch height ratio greater than .356. This measurement takes less than 15 seconds to perform. [Watch Dr. Michaud perform this measurement in the app version of this article.]
To evaluate its ability to predict motion during the gait cycle, Franettovich, et al.,12performed a two-dimensional study showing that the arch height ratio taken during static stance predicted arch height present during the midstance period of walking and running. The authors state that because the static arch ratio requires making only one mark on the skin, it is extremely reliable in determining dynamic foot position and is "the simplest and most efficient measure to obtain," with the authors reporting excellent inter- and intrarater reliability.
In a detailed three-dimensional study, Williams, et al.,13 demonstrated that the arch height ratio accurately predicts motion during the gait cycle. By quantifying arch height in runners using the arch height ratio measurement, these authors demonstrated that runners with low arches present with 32 percent faster rearfoot eversion velocities than high-arched runners. Conversely, runners identified as having high arches presented with increased vertical loading rates.
In a follow-up study,14 these same authors determined that the arch height ratio could also predict the location of potential injuries. Runners identified as having low arches exhibited more knee injuries, soft-tissue injuries and medial injuries (e.g., adductor strain, medial knee and ankle injury, and sesamoid / first metatarsophalangeal joint injury), while high arched runners had a greater prevalence of bony injuries (e.g., stress fractures) and lateral injuries (e.g., greater trochanteric bursitis, iliotibial band friction syndrome, and/or lateral ankle sprains).
Since orthotics with varus posts have been proven to reduce the velocity of pronation15 and gait retraining can reduce impact force,16 measuring the arch height ratio may allow for improved clinical outcomes, as the patient’s foot architecture may be more precisely matched to the ideal intervention.
In my experience, patients with arch height ratios of .29 or less respond extremely well to varus posted orthotics, while individuals with ratios above .34 respond best to valgus posts placed beneath the heel and gait modifications to reduce impact forces (such as switching to a midfoot contact point and/or reducing stride length).
Additional tests, including the foot mobility magnitude,17 medial drift of the medial malleolus18and supination resistance,19 are being evaluated for their ability to predict not only foot architecture, but also motion and moment arms present while walking and running. Outcomes from future studies will allow practitioners to abandon outdated biomechanical measurements in favor of simple in-office tests that predict motion and identify the most effective treatment interventions.
References
- Morton D. Structural factors in static disorders of the foot. Am J Surg, 1930;9:315.
- Harris R, Beath T. The short first metatarsal: its incidence and clinical significance. J Bone Joint Surg (Am), 1949;31:553.
- Hiss JM. Functional Foot Disorders. Oxford University Press, Los Angeles, 1949.
- Menz H. Alternative techniques for the clinical assessment of foot pronation. J Am Podiatr Med Assoc, 1998;88:119-129.
- Root M, Orien W, Weed J, Hughes R. Biomechanical Examination of the Foot. Clinical Biomechanics Corp, Los Angeles, 1971.
- Van Gheluwe, Kirby K, Roosen P, Philip R. Reliability and accuracy of biomechanical measurements of the lower extremities. J Am Podiatr Med Assoc, 2002;92:317.
- Pearce T, Buckley R. Subtalar joint movement: clinical and computed tomography scan correlation. Foot Ankle Int, 1999;20:428-32.
- McPoil T, Cornwall M. The relationship between static lower extremity measurements and rearfoot motion during walking. J Orthop Sports Phys Ther, 1996;24:309.
- Hamill J, Bates B, Knutzen K, Kirkpatrick G. Relationship between selected static and dynamic lower extremity measures. Clin Biomech, 1989;4:217-225.
- Hunt A, Fahey A, Smith R. Static measures of calcaneal deviation and arch angle as predictors of rearfoot motion during walking. Aust J Physiother, 2000;46:9-16.
- Williams D, McClay I. Measurements used to characterize the foot and the medial longitudinal arch: reliability and validity. Phys Ther, 2000;80:864-871.
- Franettovich M, McPoil T, Russell T, et al. The ability to predict dynamic foot posture from static measurements. J Am Podiatr Med Assoc, 2007;97:115.
- Williams D, McClay I, Hamill J, Buchanan T. Lower extremity kinematic and kinetic differences in runners with high and low arches. J Applied Biomech, 2001;17:153-163.
- Williams D, McClay I, Hamill J. Arch structure and injury patterns in runners. Clin Biomech, 2001;16:341-347.
- MacLean C, McClay I, Hamill J. Influence of custom foot orthotic intervention on lower extremity dynamics in healthy runners. Clinical Biomech, 2006;21,623-630.
- Heiderscheit B, Chumanov E, Michalski M, et al. Effects of step rate manipulation on joint mechanics during running. Med Sci Sports Exerc, 2011;43:296-302.
- McPoil T, Vincenzo B, Cornwall M, et al. Reliability and normative values for the foot mobility magnitude: a composite measure of vertical and medial-lateral mobility of the midfoot. J Foot Ankle Research, 2009;2:6.
- Michaud T. Biomechanics of the Foot and Ankle. In: Hyde T, Gengenbach M (eds.):Conservative Management of Sports Injuries, 2nd Edition. Sudbury MA: Jones and Bartlett; 2007: 750.
- Payne C, Munteanu S, Miller K. Position of the subtalar joint axis and resistance of the rearfoot to supination. J Amer Podiatr Med Assoc, 2003;93:131.